A little more than four months ago, nobody remembers quite how a fire was lit in the minds of a few developers who wanted more… more observability. Good enough wasn’t good enough, not when it came to the state of their precious applications, and metrics and logs weren’t satisfying. Not when new, shiny, cool telemetry signals are washing up on the beaches where all the cool kids hang out, things like traces and profiles.
Traces and Profiles deliver comprehensive views of app states
Not when Prometheus is so yesterday, and anyone who knows anything is rocking OpenTelemetry, the latest in spreading the hot goss of application statuses, the trendy tabloids of the digital world.
Trace: an observability signal that shows how long application processes take from start to finish, showing a complete view of events triggered by actions taken in the app.
Profiles: connecting system events with the actual system calls underpinning the code the application is running.
Both traces and profiles give a complete view of an application’s state, improving resolution time, decreasing developers’ cognitive load, and giving massive points to teams that use them.
This team is a trend-starter and saw the inherent value of increasing its observational capabilities. Thus, the Advanced Observability Team was born at DuploCloud, marking the start of a long, rewarding project and resulting in a stellar product showcasing everything hot about observability.

Kuzco “Oh yeah!” from Emperor’s New Groove
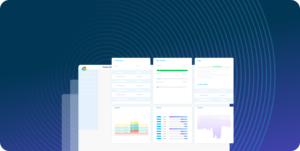
DuploCloud’s Advanced Observability Suite
Today marks the launch of this sizzling new observability platform, a culmination of nearly a year of learning, programming, researching, starting over again, deploying, testing, banging heads against keyboards, cats walking across keyboards, and so on.
As a team, we want to share some key lessons we learned throughout this process. The “A Day in the Life” series will tell (and show) you how to launch components of the Advanced Observability Suite in a true self-serve manner whenever and wherever you need them.
The team evaluated close to fifty different tools throughout the development process to be able to include the best. These tools included grand-slam hitters like OpenTelemetry from the Cloud Native Compute Foundation (CNCF), Loki from Grafana, and Prometheus’s data collection backend (also CNCF).
Some lesser-known tools include Cilium, a network connectivity tool that leverages extended Berkeley Packet Filter (eBPF). This filter collects telemetry data directly from the kernel without modifying application code and allows efficient collection of system-level events like network requests and function calls.
I wasn’t kidding earlier; this team is rad.

DuploCloud’s Advanced Observability. So hot right now.
The Advanced Observability Suite is a collection of open-source and proprietary tools, combining the best of the FOSS community with the depth of knowledge of (and excitement of) the observability team. As a SaaS product, we’ve taken on the pain of learning, combining, deploying, and managing open-source tools on behalf of our customers. Take a look at our demo here.
If you’re interested in using AOS, reach out! If you’re interested in improving your team’s observability culture, stay tuned for the following articles in our “A Day in the Life of” series.
In the meantime, go check out Cilium and learn more about eBPF. Don’t forget to check out a blog on the [Observational Maturity Model]() and boost your efforts to create that observational culture on your team (written by yours truly) Œ.
Cameron McDougle is a Dev-, Cloud-, and ML-Ops engineer passionate about the positive impact technology has and will have in the world. He is a technical marketing engineer at DuploCloud and a contributing member of the AI Technical Advisory Group (TAG) at the Cloud Native Compute Foundation (CNCF). He is a SoCal native who turned nomad and was on a bus from Lisbon to Madrid when writing this article. Follow him on LinkedIn or Twitter/X, @surfingdoggo.


