Quick Intro to Observability
Succinctly put, observability is “a measure of how well internal states of a system can be inferred from knowledge of its external outputs” [1].
In English, it’s a way to see if your application is working well and why.
This is often done with metrics (think charts and graphs) and logs (think those cryptic, nerdy messages apps ramble on about showing what they’re currently doing).
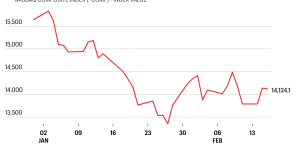
Let’s paint the picture. This graph is a standard metric showing in milliseconds how long it takes for the server to respond to someone after visiting the website.

This is a log entry showing that a visitor to the website clicked on their shopping cart:

Both are excellent ways to see what’s going on in an application, and logs are often the first place to look to debug. However, there are better ways, too, such as traces and profiles, which have become a staple of modern observability.
Tracing shows how long each interaction with the application takes, broken down by triggered event. For example, a user clicks on a button, and the amount of time in milliseconds that each system action, such as querying a database or loading an object, consumes in response is measured and shown.
Profiling correlates metrics and traces down to the system calls performed by each line of code as the app advances through its functionality, giving a complete view of user actions connected to the underlying system and everything in between.
The Observability Maturity Model
Circling back to the questions at the beginning:
How easy is it for your team to see how your app is doing?
How straightforward is it to know when something is wrong with it?
And a third question to bring it home: How painful was your last outage?
Observational maturity increases inversely to how painful it is to fix errors.
Created by AWS, the observational maturity model is a way to rate the ease of identifying and correcting errors in digital workloads. It serves as a guide to define a vision for the end game of your organization’s observability stack and prioritize what aspects to adopt first.
It establishes four levels of observational maturity, starting with a dispersed stack with limited capabilities, making it useful, and adding advanced tools. The goal is a highly polished, proactive system that utilizes historical data and machine learning to assist with root cause analysis as errors occur.
Observability is a key component of a reliable and highly available application, and when done well, it can significantly reduce developers’ cognitive load and reaction time.
How observationally mature are you?
The four stages of the observability maturity model are:
- Foundational monitoring – At this stage, basic monitoring exists in inconsistent forms across teams with no defined strategy to give a complete view of the state of the applications across the organization. Teams are reactive to issues and typically lack critical information to contextualize errors and failures.
- Intermediate monitoring – KPIs are identified, and telemetry data is collected and aggregated into a central dashboard that includes visualizations and alerting strategies that define what teams to involve, given the issues. Historical knowledge lends toward more effective troubleshooting. Mean Time-To-Resolution (MTTR) is much lower. However, debugging is still a significant cognitive load, and developers can be overwhelmed by the data and unsure which is most relevant.
- Advanced observability – Understanding the root causes of issues is much more accessible through additional signals like traces and profiles (more on those below). Issues can be identified quickly, and organizations can effectively adhere to their Service Level Objectives (SLOs) and Service Level Agreements (SLAs). Anomaly detectors are introduced to watch for outlying trends compared to typical patterns, offering near real-time alerting.
- Proactive observability – The holy grail of observability is that issues are detected as they occur using machine learning models that can identify root causes in real time, offering resolution options to resolve the problems.
Now, the soul-searching question: which level are you? How is your level of observational maturity affecting your day-to-day? And what can you do about it?
Observability is as much a culture as a fancy software stack with pretty graphs and charts. Doing it well means reviewing different aspects of application architecture and the awareness observability offers regularly, meaning you’ll need buy-in from various stakeholders.
Or in other words, those of Professor Moody,

Where you go from here
“What can I make of all this,” you ask. Start by learning more about observability.
The AWS Observability Maturity Model [2] is a great read, as is the Cloud Native Compute Foundation (CNCF)’s Technical Advisory Group (TAG)’s whitepaper on observability [3] (whoa! – sorry, no more acronyms from me). Both organizations have major footholds in the observability market, the latter being the sponsoring organization behind both Prometheus and OpenTelemetry.
Start implementing either of those—Prometheus or OpenTelemetry—alongside your digital workloads. Adding Grafana to visualize the data is another great place to start. They’re all invaluable skills and well worth the time investment.
Or, you know, call us, and we’ll gladly help you. We know a thing or two about observability with the recent launch of our Advanced Observability Suite (today!!) featuring OpenTelemetry. Lately, I’ve been working alongside the brilliant engineers who built it.
Stay tuned! This blog article is one of many we are putting together as a team to teach and encourage a culture of observability.
Peace out!
Cameron McDougle is a Dev-, Cloud-, and ML-Ops engineer passionate about the positive impact technology has and will have in the world. He is a technical marketing engineer at DuploCloud and a contributing member of the AI Technical Advisory Group (TAG) at the Cloud Native Compute Foundation (CNCF). He is a SoCal native who turned nomad and was on a bus from Lisbon to Madrid when writing this article. Follow him on LinkedIn or Twitter/X, @surfingdoggo.
Sources
[1] Kalman R. E., On the General Theory of Control Systems, Proc. 1st Int. Cong. of IFAC, Moscow 1960 1481, Butterworth, London 1961, as quoted in the CNCF TAG Observability Whitepaper[2].
[2] [AWS Observability Maturity Model](https://aws-observability.github.io/observability-best-practices/guides/observability-maturity-model/)
[3] CNCF TAG Observability Whitepaper](https://github.com/cncf/tag-observability/blob/main/whitepaper.md)


